Charts
Charts allows you to display data from Allsky and modules within the WebUI
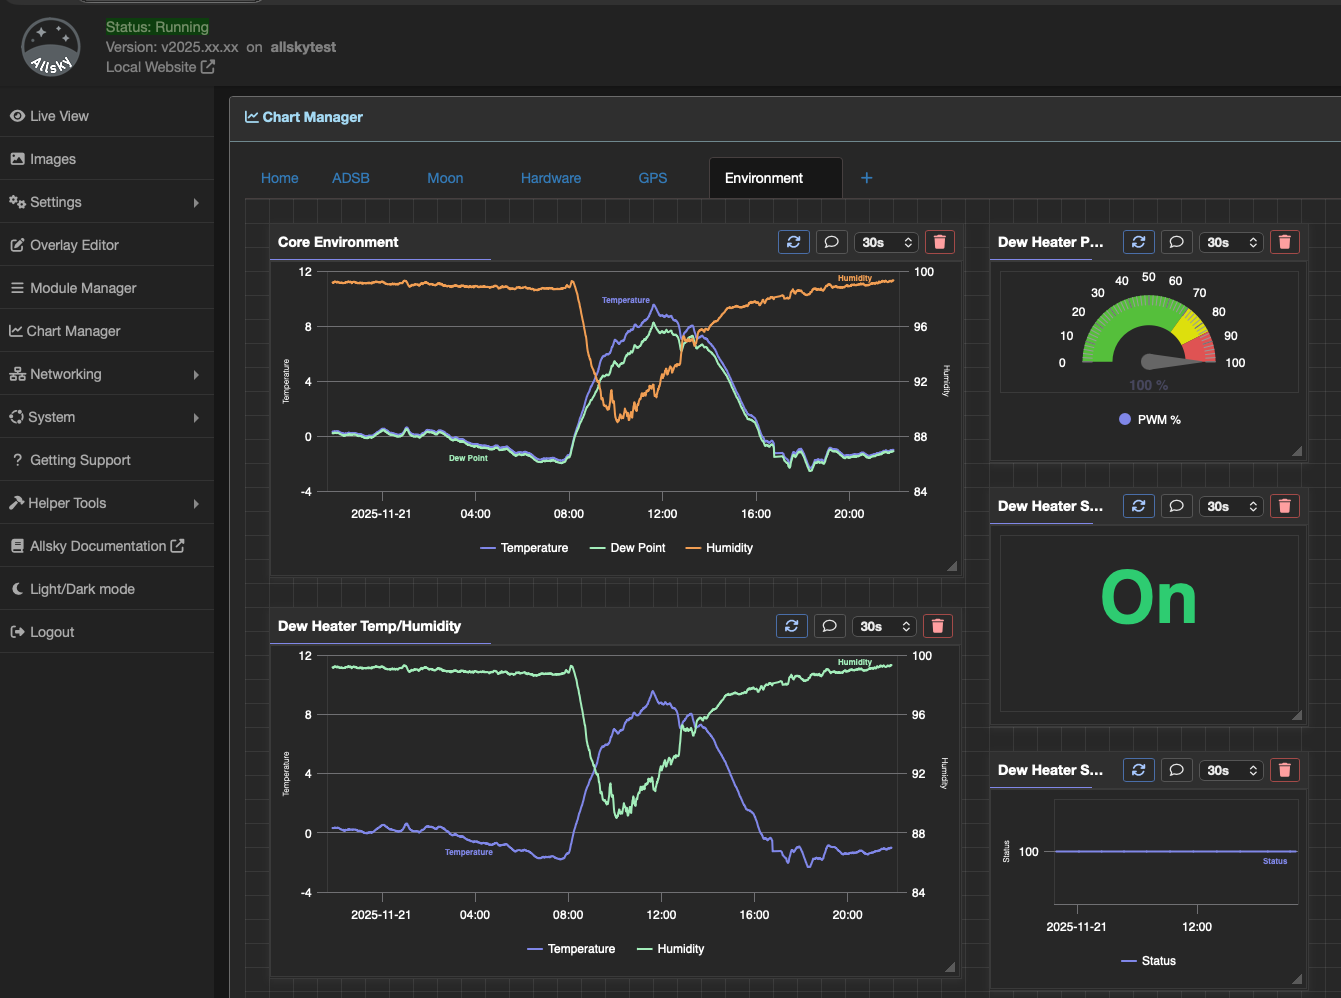
The Web UI Charts Page
You can provide custom charts for use with your module. There are a few prerequisites to doing this
- You must be saving data in the database
- You should have a good understanding of Highcharts although it is entirley possible to copy and modify existing charts of all you need are basic ones
There are several charts types available
- Line - A line graph
- Spline - A smoothed line chart
- Gauge - A guage
- Yes/No - A chart that displays Yes or No
There other charts types supported all of which are standard Highcharts so please refer to the Highcharts documentation for details
Chart Types
Line Charts
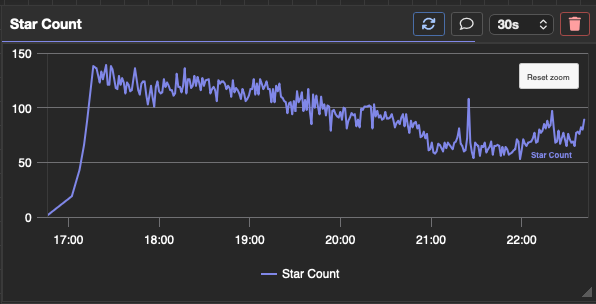
Single axis line chart
Multi axis line chart
Single axis
The following defines a line chart showing the total number of aircraft seen by the adsb module.
| field | Description |
|---|---|
| icon | Any valid fontawesome icon |
| group | The group the chart belongs to, when using the Chart Manager charts will appear in these groups |
| title | The charts title |
| type | The type of chart |
| main | If true then this chart will be used in the module manager to display the history |
| table | The table the chart is getting data from |
| yAxis | Only set the 'text' to the title of the Y axis |
| series | Set the variable to the Allsky Variable containing the data to chart |
The 'main' chart
When creating charts for your module it is strongly suggested that you create a chart with main set to true. There must only be one chart within your module with main set to true
{
    "icon": "fas fa-chart-line",
    "group": "ADSB",
    "title": "Total Aircraft",
    "type": "line",
    "main": true,
    "table": "allsky_adsb",
    "yAxis": [
        {
            "title": {
                "text": "Total Aircraft"
            }
        }
    ],
    "series": [
        {
            "name": "Aircraft",
            "variable": "AS_TOTAL_AIRCRAFT"
        }
    ]
}
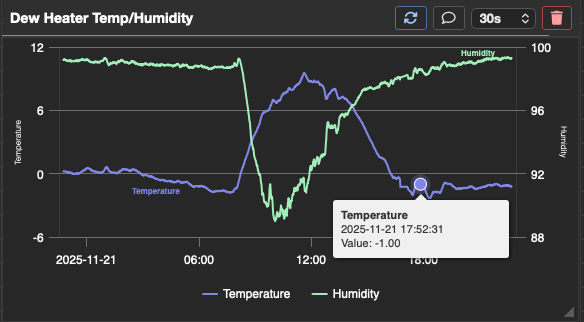
Multiple axis
It is possible to create a chart with multiple Y axis.
When using multiple axis there are a few things to bear in mind. The opposite setting in the yAxis forces the axis to the other axis. The yAxis value in the series defines which axis the data will appear against
{
    "icon": "fas fa-chart-line",
    "group": "Environment",
    "title": "Dew Heater Temp/Humidity",
    "type": "line",
    "table": "allsky_dewheater",
    "main": true,
    "yAxis": [
        {
            "title": {
                "text": "Temperature"
            }
        },
        {
            "title": {
                "text": "Humidity"
            },
            "opposite": true
        }
    ],
    "series": [
        {
            "name": "Temperature",
            "yAxis": 0,
            "variable": "AS_DEWCONTROLAMBIENT"
        },
        {
            "name": "Humidity",
            "yAxis": 1,
            "variable": "AS_DEWCONTROLHUMIDITY"
        }
    ]
}
Spline Charts
The configuration for a spline chart is identical to a line chart except the type is set to spline.
Gauges
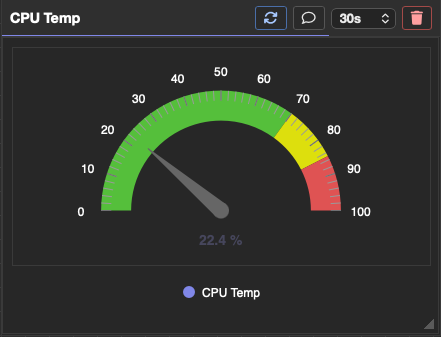
An example Gauge
Gauges can be built using a very simple config as below.
{
    "title": "Dew Heater PWM %",
    "icon": "fa-solid fa-gauge",
    "type": "gauge",
    "group": "Environment",
    "table": "allsky_dewheater",
    "series": [
        {
            "name": "PWM %",
            "variable": "AS_DEWCONTROLPWMPERCENT"
        }
    ]
}
Gauges can also be overriden using Highcharts to customise the view
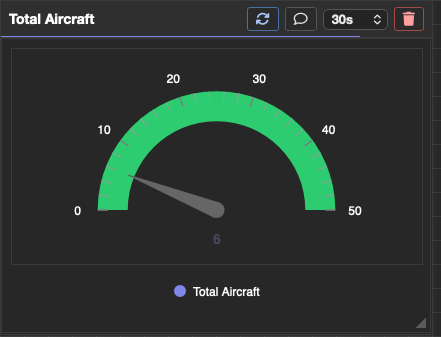
An example custom Gauge
The full extent of customisation is beyon the scope o this document. Please refer to the Highcharts documentation for details
{
    "title": "Total Aircraft",
    "icon": "fa-solid fa-gauge",
    "type": "gauge",
    "group": "ADSB",
    "table": "allsky_adsb",
    "hc": {
        "yAxis": [
            {
                "min": 0,
                "max": 50,
                "tickInterval": 10,
                "tickPosition": "inside",
                "lineWidth": 0,
                "labels": {
                    "distance": 20,
                    "style": {
                        "fontSize": "12px"
                    }
                },
                "plotBands": [
                    {
                        "from": 0,
                        "to": 200,
                        "color": "#2ecc71",
                        "thickness": 30
                    }
                ]
            }
        ],
        "pane": {
            "startAngle": -90,
            "endAngle": 90,
            "center": [
                "50%",
                "75%"
            ],
            "size": "110%",
            "background": null
        }
    },
    "series": [
        {
            "name": "Total Aircraft",
            "variable": "AS_TOTAL_AIRCRAFT",
            "options": {
                "tooltip": {
                    "valueSuffix": ""
                },
                "dataLabels": {
                    "format": "{y}"
                },
                "dial": {
                    "radius": "80%",
                    "baseWidth": 16,
                    "baseLength": "0%",
                    "rearLength": "0%"
                },
                "pivot": {
                    "radius": 8
                }
            }
        }
    ]
}
Yes/No Charts
These simply display text based upon a thruthy value.
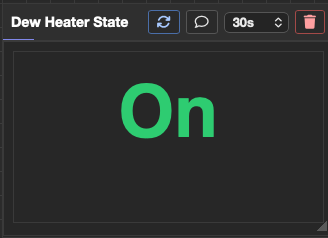
An example Yes / No Chart
The important values here are the truetext, falsetext and the associated colour fields
{
    "icon": "fas fa-lightbulb",
    "group": "Environment",
    "title": "Dew Heater State",
    "type": "yesno",
    "table": "allsky_dewheater",
    "hc": {
      "yesNo": {
        "trueText": "On",
        "falseText": "Off",
        "trueColor": "#2ecc71",
        "falseColor": "#e74c3c",
        "fontSize": "72px"
      }
    },
    "series": [
        {
            "name": "Heater State",
            "yAxis": 0,
            "variable": "AS_DEWCONTROLHEATERINT"
        }
    ]
}
Distributing
To include charts with your module simply create the config and add them to the charts folder withing the module repository. The installer will then copy the charts to the correct location within Allsky.